Current Trends in the National Real Estate Market
The real estate market is a dynamic landscape, constantly evolving with economic shifts and global events. As we step into April 2026, we’re observing significant changes that are reshaping opportunities for both homebuyers and sellers. The data from March 2026 paints a picture of a market in flux: the national median home list price, for instance, registered at $415,450, showing a slight decrease compared to the previous year. This, alongside a gradual inventory recovery, signals a potential shift towards more buyer-friendly conditions.
Understanding these intricate movements is vital for making sound decisions. Whether you’re assessing property values for a potential purchase or sale, accurate Real estate market valuations are more important than ever.
We will guide you through the key trends shaping the current market. We’ll explore national and regional shifts in pricing and inventory, examine how mortgage rates are influencing affordability, and compare the for-sale and rental markets. Our goal is to provide you with clear insights into the risks and opportunities present in today’s housing environment.
As of March 2026, the U.S. housing market is navigating a period of significant adjustment. We are seeing a nuanced interplay of inventory growth, moderating prices, and an extended time on market, all contributing to a landscape that is notably different from the frenzied conditions of recent years.
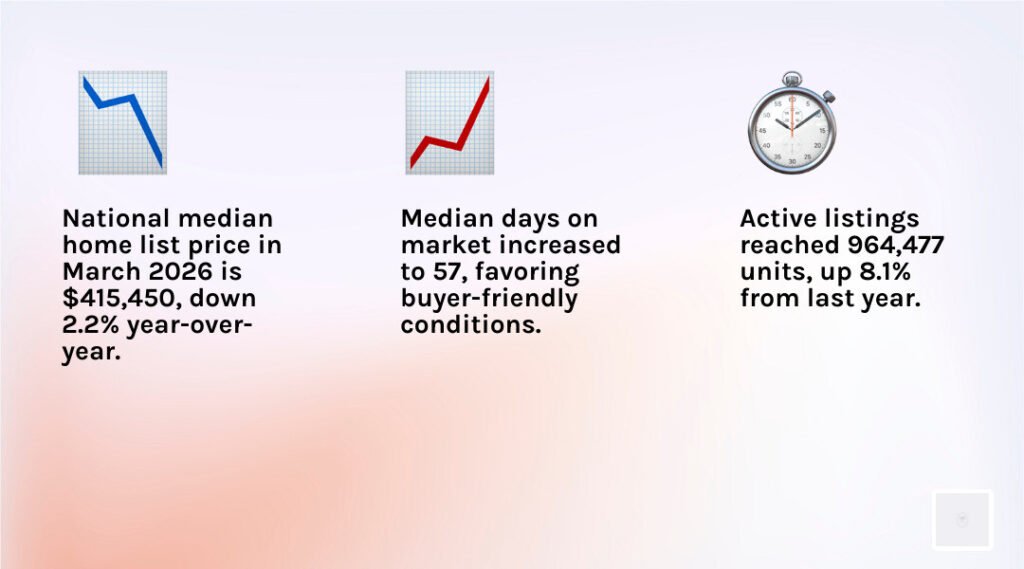
The national median home list price in March 2026 stood at $415,450. This figure represents a 2.2% decline year-over-year, marking the fifth consecutive month of year-over-year price reductions. This trend suggests a recalibration of seller expectations and an emerging buyer-friendly environment. Active listings nationwide reached 964,477 units in March 2026, an encouraging increase of 8.1% compared to the previous year. While this growth is positive, it’s crucial to note that national inventory remains 13.8% below the typical levels observed in the pre-pandemic years of 2017-2019. This persistent gap indicates that while supply is improving, it has not yet fully caught up to historical norms. For a broader perspective on the health of the housing sector, the National Association of Realtors provides a comprehensive Residential Real Estate Market Snapshot that offers valuable insights into these national indicators.
Homes are also spending more time on the market. The median days on market in March 2026 increased to 57 days, up by 4 days year-over-year. This extended period suggests that buyers have more options and less pressure to make immediate offers, further reinforcing the shift toward a more balanced market. Additionally, the price per square foot saw a 2.2% decline year-over-year, indicating that the softening in prices is not merely due to a shift in the mix of homes sold (e.g., more smaller homes) but reflects genuine price adjustments.
These national trends collectively paint a picture of a market that is cooling from its peak, offering potential advantages for prospective buyers. The following table summarizes key national metrics for March 2025 and March 2026, highlighting these important shifts:
Metric March 2025 (Estimated/Inferred) March 2026 Change YoY Median Listing Price ~$424,780 (approx.) $415,450 -2.2% Active Listings ~892,200 (approx.) 964,477 +8.1% New Listings ~436,000 (approx.) 439,000 +0.7% Median Days on Market 53 days (approx.) 57 days +4 days Listings with Price Cut 17.4% (approx.) 16.2% -1.2 pp Pending Sales (Data not provided) +3.9% (YoY increase) Inventory vs. Pre-pandemic 2017-19 (Data not provided) -13.8% (YoY comparison) Note: March 2025 figures are estimated based on the provided YoY changes for March 2026 data.
Regional Shifts in the Real Estate Market
While national trends provide a broad overview, the real estate market is inherently local, with significant variations across different regions and metropolitan areas. March 2026 data reveals distinct patterns in inventory growth and price adjustments, creating diverse opportunities and challenges.
Certain major metros are experiencing notable shifts. Seattle, for instance, has seen a remarkable surge in active listings, up 42.5% year-over-year in March 2026. This substantial increase in available homes offers buyers in the Seattle area considerably more choice than they had a year ago. Conversely, other regions are experiencing significant price corrections. Austin’s median list price dropped by 7.9% year-over-year to $469,500, while Memphis saw an even steeper decline of 10.3% to $299,450. These price adjustments, particularly in markets that saw rapid appreciation in previous years, could present compelling entry points for buyers. For those interested in diverse market segments, understanding the dynamics of different regions, from the bustling activity in Seattle to the unique characteristics of the Chicago luxury real estate market, is key.
Regional disparities in inventory recovery are also stark. The Northeast continues to grapple with significant supply constraints, with active listings still 54.1% below pre-pandemic levels in March 2026. This persistent shortage contributes to upward pressure on prices in many Northeastern markets, despite national trends. For example, while national price per square foot declined, the Northeast saw a robust 3.8-4.3% year-over-year increase in January 2026, reflecting intense competition for limited available properties. In contrast, the South has shown a more robust inventory recovery, with active listings up 2.4% compared to pre-pandemic levels. This region’s ability to approach or exceed previous supply benchmarks suggests a more balanced market for buyers.
Exploring specific local markets can further illustrate these variations. For example, understanding the unique residential offerings in a place like Hilton Head Island – Moss Creek Ct provides a micro-level view of how regional dynamics play out. Similarly, keeping an eye on local events like SC 29909 Open Houses can offer real-time insights into buyer activity and seller engagement in specific zip codes. These regional and metro-specific insights are crucial for both buyers and sellers looking to navigate the market effectively.
Inventory and Pricing in the 2026 Real Estate Market
The dynamics of inventory and pricing are critical indicators of the housing market’s direction. As we move into April and the summer of 2026, new listings and pending sales trends offer valuable clues about future momentum.
New listings in March 2026 totaled 439,000, showing a modest 0.7% increase year-over-year. While this growth is positive, year-to-date new listings were still down 1.6% compared to 2025. This suggests that while some sellers are entering the market, overall seller confidence may still be somewhat subdued, possibly influenced by economic uncertainties or the expectation of further market shifts. However, March also saw a significant month-over-month increase in new listings (over 20%), indicating a potential pick-up as the spring season progresses. This momentum in new inventory is a key factor to watch, as it directly impacts buyer choice and market competition.
A notable trend in pricing is the prevalence of price cuts. In March 2026, 16.2% of listings saw a price cut, which is down 1.2 percentage points year-over-year. This reduction in the percentage of listings with price cuts suggests that sellers are becoming more realistic with their initial asking prices, learning from the market adjustments seen in 2025. This strategic pricing at the outset can lead to quicker sales and a more efficient market. For sellers, understanding how to price competitively from the start is paramount. This contrasts with the often-complex pricing strategies seen in specialized markets, such as the Detroit furnished apartment market, where rental rates and property values are influenced by short-term demand and specific amenity offerings.
Looking ahead, pending sales offer a forward-looking indicator of market health. In March 2026, pending sales were up 3.9% year-over-year, marking the third consecutive month of year-over-year increases. This sustained growth in pending sales suggests a resilient buyer demand, likely fueled by improved affordability conditions and slightly lower mortgage rates compared to peak levels. This momentum indicates that despite broader economic concerns, serious buyers are actively engaging with the market. Whether you’re exploring established communities like Upper Saucon Twp – Liberty Bell Gardens or considering new developments in areas like Winchester KY – Bloomfield Addition, these trends in new listings and pending sales are crucial for anticipating market activity in the coming months.
Economic Influences and Mortgage Rate Evolution
The broader economic landscape plays a pivotal role in shaping the real estate market. As of April 2026, several macroeconomic factors are influencing buyer demand and seller decisions, particularly the evolution of mortgage rates and global uncertainties.
Mortgage rates have been a significant determinant of affordability and buyer activity. While rates saw some fluctuations throughout March 2026, they remained generally lower than those observed in the previous year, contributing to an improved affordability picture. This is reflected in the NAR Housing Affordability Index, which reached its highest level since March 2022 in January 2026. This improved affordability, coupled with a slight easing of home prices, has provided a window of opportunity for many prospective buyers.
However, the market is not immune to external pressures. Geopolitical tensions, particularly those in the Middle East, and broader economic uncertainty continue to cast a shadow. Federal Reserve officials have acknowledged these global disruptions, and while they have not directly led to immediate rate cuts, they influence market sentiment and investor behavior, which can indirectly affect mortgage rates. The potential for tariffs, such as those on building materials like lumber, could also impact the housing market. Reports from 2025 indicated that such tariffs were expected to increase U.S. new home construction costs, a factor that could limit future supply and, consequently, influence pricing.
These economic conditions underscore the importance of careful financial planning for homebuyers. Understanding the full scope of property details, from a home in Leeds AL Property Details to a specific parcel in Ozark AL 170, becomes even more critical when considering the long-term financial commitment amidst fluctuating rates and economic forecasts. Despite these headwinds, the resilience of buyer demand, evidenced by the increase in pending sales, suggests that many are seizing the current, relatively more favorable conditions. The balance between improved affordability and ongoing economic uncertainties will continue to define the market’s trajectory in the months ahead.
Comparing For-Sale and Rental Market Landscapes
The housing market isn’t just about buying and selling; the rental sector also plays a crucial role, often reflecting and influencing the for-sale market. In major U.S. cities, the dynamics of rental markets compared to for-sale markets present a varied picture.
Globally, and in many major U.S. cities, rental markets have seen significant shifts. Some international examples highlight the intensity of rental demand: Madrid, for instance, experienced one of the largest global rent increases, heavily driven by tourism and a robust job market. Similarly, Tokyo property prices and rents have surged due to a weak yen, increased tourism, and foreign investment. While these are international examples, they illustrate the powerful forces that can drive rental costs. In the U.S., major cities often face similar pressures from population growth, job markets, and limited housing supply, leading to competitive rental environments.
The availability of rental listings can offer insights into housing affordability and demand. When rental options are scarce and expensive, it can push some consumers towards homeownership, if they can afford it. Conversely, a robust rental market with diverse options can alleviate pressure on the for-sale market, particularly for those who are not yet ready or able to purchase a home. The number of available listings, such as those for GA 33406 Condos Open Houses, directly impacts pricing and vacancy rates in local rental markets.
The interplay between the for-sale and rental markets is complex. High mortgage rates can make homeownership less accessible, keeping more people in the rental pool and driving up rental demand. Conversely, lower home prices and improved affordability can draw renters into the homeownership market. The current landscape, with slightly lower home prices and improved affordability, might encourage some renters to explore buying. However, the overall shortage of housing inventory, particularly in the for-sale market, means that both sectors remain competitive. Even in specialized segments like CA 92405 Land Coming Soon, the demand for housing, whether for building or renting, remains strong.
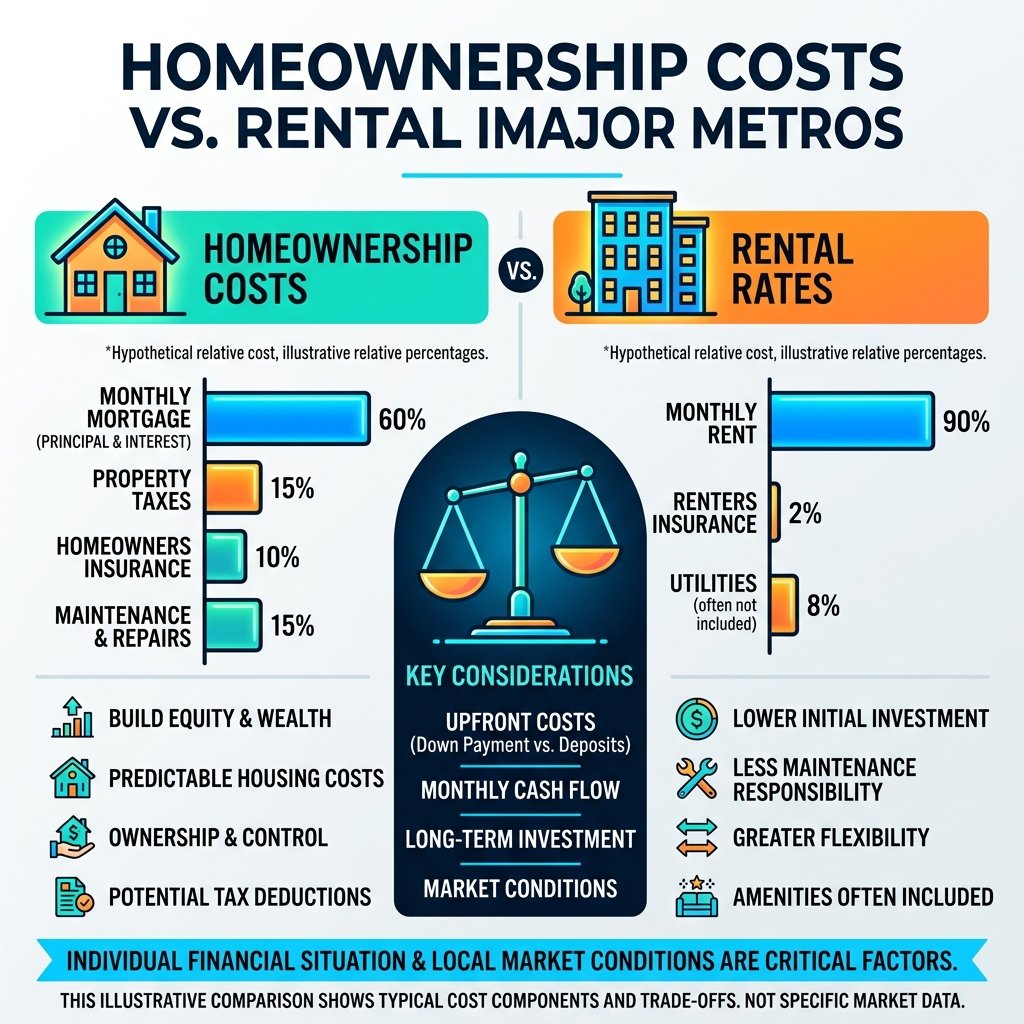
Understanding the relative costs of homeownership versus renting is crucial for individuals making housing decisions. This infographic helps visualize the financial considerations in major metropolitan areas:
The choice between renting and buying often comes down to individual financial situations, long-term goals, and local market conditions, but the overall health of both markets influences the broader housing economy.
Strategic Outlook for Buyers and Sellers
As we navigate the 2026 housing market, both homebuyers and sellers face a unique set of risks and opportunities. Understanding these dynamics is key to making informed decisions in the months ahead.
For buyers, the current market presents several compelling opportunities. The median list price has seen a year-over-year decline for five consecutive months, and active listings are up 8.1% compared to a year ago. This means more choices and potentially less intense bidding wars. While the national inventory recovery is still in progress, remaining 13.8% below pre-pandemic levels, the increase in available homes and the slight extension of the median days on market (57 days) empower buyers with more negotiating leverage and time to make decisions. Improved affordability, driven by these price adjustments and mortgage rates that are generally lower than previous peaks, further enhances the buyer’s position. For families considering a move, researching specific school districts, such as those in King County WA Schools – Griffin Home, becomes more feasible with increased inventory.
However, risks for buyers include the persistent inventory gap in some regions, which could still lead to competition, and the ongoing economic uncertainty that might impact future mortgage rates. Buyers should stress-test their budgets and consider potential rate fluctuations.
For sellers, the market demands a strategic approach. While buyer demand remains resilient (pending sales up 3.9% YoY), the days of automatic bidding wars and skyrocketing prices are largely behind us. The decrease in the percentage of listings with price cuts (16.2% in March 2026, down 1.2 pp YoY) suggests that sellers are increasingly pricing their homes realistically from the outset. This is a crucial lesson from 2025: homes priced competitively from day one are more likely to sell faster and avoid the need for subsequent reductions. Monitoring new listings momentum, particularly in April, will be a key indicator of overall seller confidence and market activity. For sellers, presenting a home in its best light, whether it’s a property in Hammond IN Property Details or elsewhere, and pricing it right are paramount.
The main risk for sellers is overpricing, which can lead to longer time on market and ultimately necessitate price reductions. Opportunities lie in leveraging the sustained buyer demand and the strategic advantage of realistic initial pricing. The spring season typically brings increased activity, and sellers who position their properties wisely can still achieve favorable outcomes.
In summary, the 2026 housing market is evolving towards a more balanced state. Buyers benefit from increased choice and improved affordability, while sellers who adapt to current market realities by pricing strategically can still achieve successful sales. Both parties should remain vigilant to economic indicators and regional nuances to maximize their outcomes.
Frequently Asked Questions about the Real Estate Market
What are the current national trends in median home list prices as of March 2026?
As of March 2026, the national median list price stands at $415,450, representing a 2.2% decrease compared to the previous year. This marks the fifth consecutive month of year-over-year price declines, signaling a shift toward more buyer-friendly conditions. The price per square foot also saw a 2.2% decline year-over-year, indicating a genuine softening in prices rather than just a change in the types of homes sold.
How does current housing inventory compare to pre-pandemic levels?
While active listings have grown by 8.1% year-over-year to reach 964,477 units in March 2026, the national inventory remains 13.8% below the typical levels seen between 2017 and 2019. This indicates that despite recent gains, the market has not yet fully recovered to historical supply levels. Regionally, the South has nearly recovered (+2.4% vs. pre-pandemic), while the Northeast still faces a significant deficit (-54.1% vs. pre-pandemic levels).
Which metropolitan areas are seeing the most significant market shifts?
Metros like Seattle have seen active listings surge by over 42.5% year-over-year in March 2026, offering buyers significantly more choice. Conversely, Austin experienced a median list price decrease of 7.9% year-over-year to $469,500, and Memphis saw an even larger decline of 10.3% to $299,450. These price adjustments in certain metros indicate a significant recalibration in those local markets.
Conclusion
As we’ve explored, the real estate market in April 2026 is characterized by a complex interplay of forces. We are witnessing a period of market stabilization, marked by a gradual increase in inventory and a moderation of home prices. These shifts contribute to improved affordability, offering a more welcoming environment for many homebuyers.
For sellers, the emphasis has shifted towards strategic and realistic pricing, which is proving to be more effective than aggressive initial pricing. The overall market momentum, indicated by rising pending sales, suggests a resilient demand base ready to engage with well-positioned properties.
Whether you are looking to buy your first home, sell an existing property, or invest in real estate, understanding these trends is paramount. The long-term benefits of homeownership, including building equity and personal wealth, remain compelling. We encourage you to explore more listings, connect with a local expert, and work with a trusted ez Home Search partner to navigate this evolving landscape successfully.